15 The Cosmic Microwave Background
Observations of the cosmic microwave background form the bedrock of modern observational cosmology. The existence of radiation almost uniformly spread across the sky at 2.73K was the clinching evidence that confirmed our universe had once been hot and dense, leading to the acceptance of the “big bang” picture in the 1960s. Over subsequent years, the spectrum of this radiation was confirmed to be a perfect blackbody within the bounds of experimental error (Figure 19).
The existence of such a blackbody is a natural prediction within the context of a big bang universe. Extrapolating the temperature back in time according to where is the redshift4141 41 This behaviour of the temperature can be inferred either from the changes in energy of individual photons or from the fluid conservation equations, both of which we have studied earlier in the course, by there is a significant tail of high-energy photons that are capable of ionising hydrogen. In fact detailed calculations show that the hydrogen in the universe largely recombined at . Over the redshift interval (corresponding to 99.997% of the age of the Universe) the majority of CMB photons have not been scattered. The radiation we see all around us tells us directly about the Universe just a few hundred thousand years after its inception. The first thing that we understand from these observations is that the universe at this time was remarkably uniform – something that we’ve invoked cosmic inflation to understand.
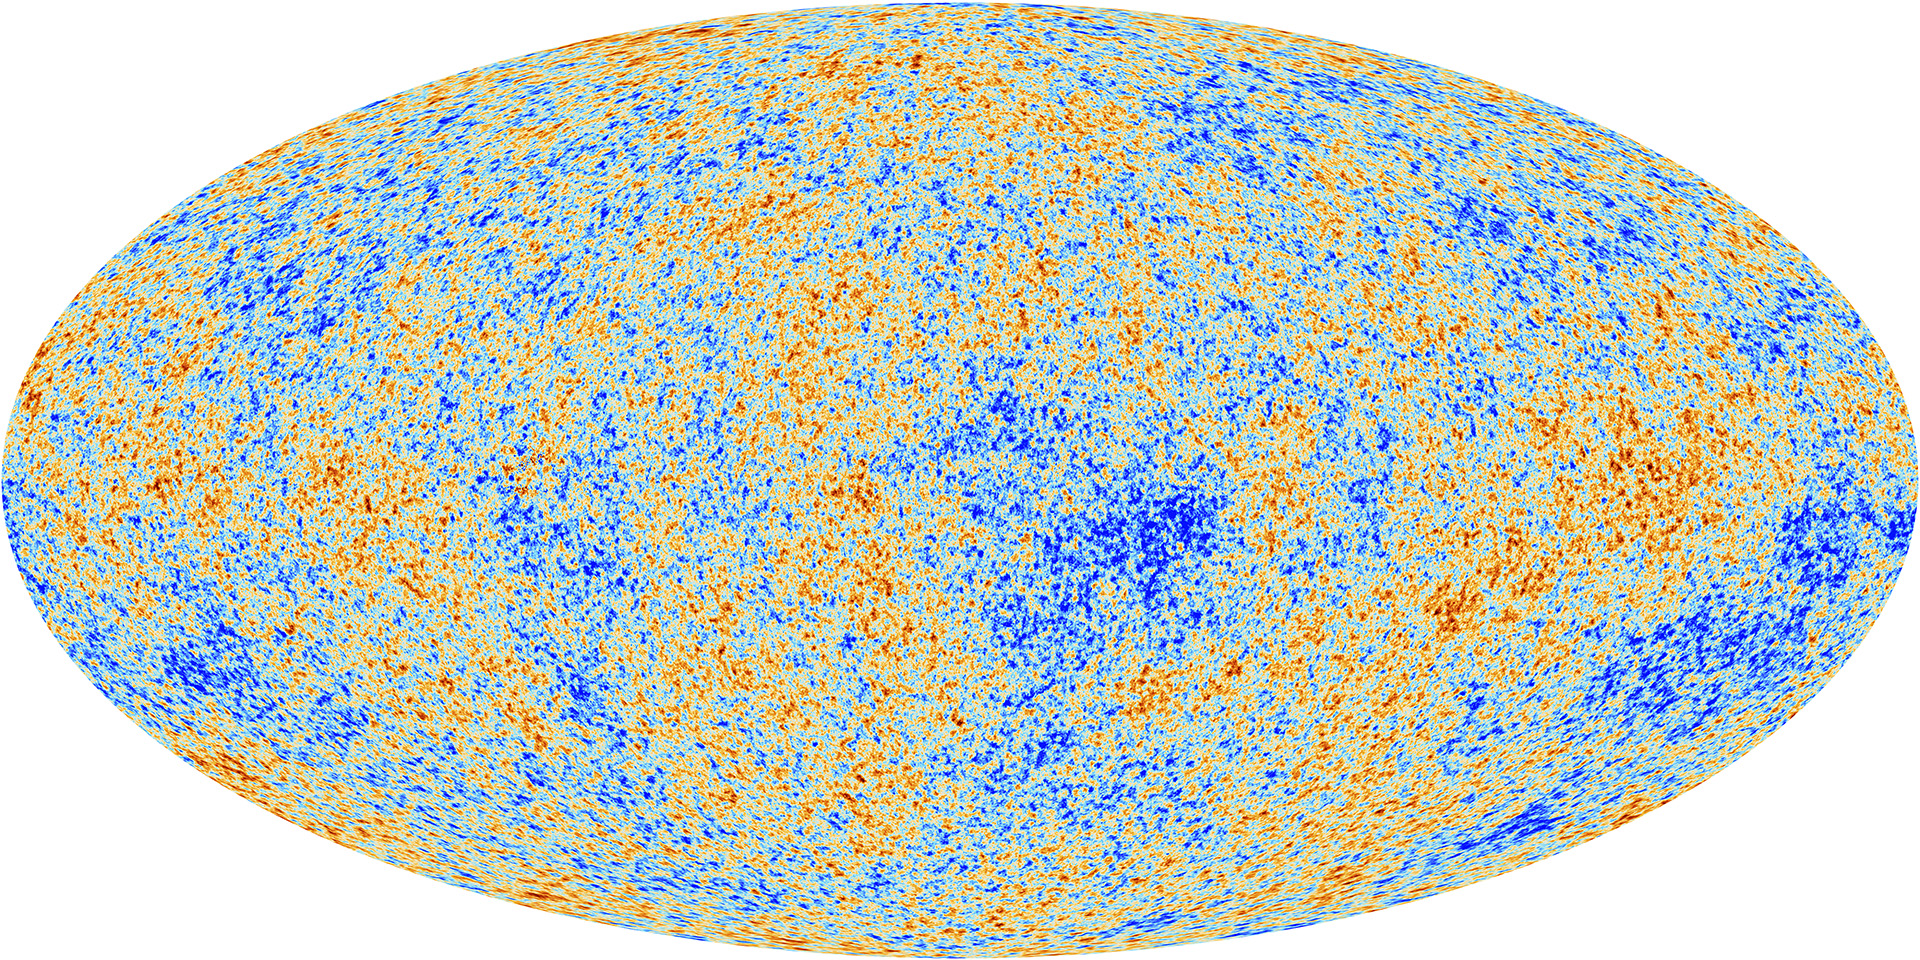
To seed the structure in the universe today, we require some ripples of a small amplitude to have been present at early times. The expected tiny fluctuations in the temperature of the observed radiation were first detected by COBE in the 1990s. The RMS on the scales that it was able to resolve were K, less than one part in . Subsequent space missions (WMAP and Planck) have now measured these temperature variations with exquisite precision down to angular scales of under a tenth of a degree. These missions have pushed cosmology into a new era where we are able to quantiatively model the early universe and constrain its constituents.
Cosmic inflation is a strange theory and, as we have discussed, is currently somewhat phenomenological as it has not been derived from a fundamental, lab-testable theory of physics. But we have also seen that it predicted that the fluctuations in the early universe would be nearly scale-free, with a slight red tilt to the spectrum; see equation (418). This prediction has been spectactularly confirmed with WMAP and then Planck observations, which lends a lot of weight to the reality of inflation or something that is very much like it. In this final section of the course, we will outline how the density fluctuations in the early universe manifest themselves in today’s CMB observations. We will also see how features imprinted by the transfer function give us a handle on cosmological parameters.
The frontier of CMB research is to measure the polarisation with greater precision across the full sky. We will not formally touch on the polarisation since it requires more machinary than we have time to develop, but should point out that another inflationary prediction – the existence of primordial gravitational waves (Section 3) – is imprinted on the polarisation of the CMB in a unique way.
15.1 The tight-coupling approximation
 |
To understand structure in the CMB (and in the universe today), working from an assumption of primordial fluctuations generated by inflation, one needs to solve a set of coupled equations from the early radiation era through to the present. The source terms that appear in these equations include:
-
1.
non-relativistic standard-model baryons (protons, neutrons) and leptons (electrons) – cosmologists often refer collectively to just “baryons” since these dominate the mass/energy content;
-
2.
photons;
-
3.
other relativistic species (neutrinos);
-
4.
dark matter;
-
5.
potentially, dark energy.
Dark energy in its simplest form is a cosmological constant that does not cluster and only enters at the background level. The relationship between all other fluids is complex and multi-faceted.
Research-level CMB cosmology makes use of a Boltzmann hierarchy which describes how the populations of particles interact with each other through electromagnetism and gravity (see e.g. http://camb.info). We don’t have time to develop the extra machinery that this entails and in any case it’s not terribly enlightening – one just gets bogged down in a load of technical detail. To gain physical insight into what the results mean, we normally fall back to a simpler description.
The first simplification one can make is known as the tight-coupling approximation. Because of their Coulomb interaction, electrons and protons behave as one single fluid even when ionised. Furthermore, before recombination, the mean-free-path of a photon was very small.
😇 Exercise 15A
Show that the comoving mean-free-path of a photon, assuming the universe is completely ionised, is approximately
| (426) |
where is the Thomson cross-section for scattering of a photon by an electron, is the physical number density of electrons at a given scalefactor , and is the proton mass. You can assume that the universe is electrically neutral and ignore the effects of helium, so that .
Calculate at , giving the answer in Mpc.
The exercise above should demonstrate that the mean free path of a photon for is small compared to cosmological scales of interest. The direct coupling between photons and protons is vastly smaller (suppressed by a factor of the proton mass squared) – but it doesn’t matter, because the photon couple to the electrons and the electrons couple to the protons. For small-scale features, and as the universe recombines at , the finite mean-free-path does start to matter and the “looser” coupling between baryons and photons starts to play a part (Section 9). However, it’s a good approximation in many cases to assume the fluids are completely tightly coupled. We will then be left with a universe filled with three effective fluids: the baryon-photon combined fluid, dark matter and neutrinos. To keep things tractable, we’ll ignore the neutrinos, which have minor gravitational effects compared to that of the dark matter.
15.2 Multi-fluid structure formation
When we studied relativistic structure formation in Section 13, we assumed that the universe had just one fluid component. Even in our simplified treatment for the CMB, however, we’ll need to consider two (the photon-baryon combined fluid, and the dark matter).
To do this coherently, we need to decouple the fluid evolution equations from the Einstein equations. The way to do this is to use the conservation of energy-momentum which is individually satisfied by the different fluids. Then the Einstein equation itself is used at the last stage to calculate the potential .
We can start by rewriting equation (365) and (366) substituting , . We also make a presentational simplification by writing and multiplying the second equation through by , giving rise to
| (427) | ||||
| (428) |
in conformal Newtonian gauge. Next, let’s specialise to the case of cold dark matter (or uncoupled baryons) and photons , giving
| CDM or uncoupled baryons | (429) | ||||||
| radiation | (430) |
where the subscript and indicate CDM and radiation respectively (they are not indices). I want to emphasise one more time that these equations apply to the individual fluids when they are not interacting except through gravity. In the perfect-fluid assumption that we are adopting, from vanishing anisotropic stress, equation (353). Once supplemented with the appropriate Poisson-like equation for , equation (354a) (with a sum over the two fluids to get the total ), they tell us how a universe built out of non-interacting CDM and radiation fluids would evolve.
15.3 The bare-bones CMB
The very simplest calculation that can give us some insight into the CMB takes equation (430) to describe the coupled baryon-photon fluid (ignoring the mass of the baryons themselves!). We can even ignore the gravitational effects, so that the CDM and photons completely decouple.
It’s helpful for comparison to observations to work not with the density and overdensity but instead with the temperature and its perturbation . The relationship is determined by the Stefan-Boltzmann law:
Ignoring gravity and the mass-loading of baryons, we have been able to boil everything down to two simple equations, (432) and (433). To recap, the first is the continuity equation, expressing the conservation of photons. The second is the Euler equation, expressing how velocity is generated by pressure gradients. In due course we need to modify them to re-introduce gravity and baryon loading, but first let’s examine the properties of this bare-bones version of the CMB.
By taking the derivative of equation (432) and substituting equation (433), we end up with a single second order differential equation for :
| (434) |
which describes a simple harmonic oscillator with angular frequency . The sound speed is therefore (as a fraction of the speed of light which is ).
It is helpful to write the solutions
| (435) |
Here, is the sound horizon, i.e. the comoving distance through which disturbances in the fluid can have travelled since . For the case that we are dealing with where is constant, we could just write but the more complex form given above remains approximately true in cases where varies (Section 8).
To go further we need to understand the initial conditions and . These have been sourced from the end of inflation as described in Section 14. As , all modes of cosmological interest will start outside the horizon, meaning . Then, looking at equations (354a) and (354b) in the limit , we find that (so in our new notation ) whereas . The appropriate initial conditions therefore set , and we have simply
| (436) |
This solution applies up to the time of decoupling, but not afterwards: remember that the fluid solutions that we are examining apply in the tightly-coupled limit where baryons are present to scatter the photons and keep them isotropic. Even though we have so far neglected the mass density, we are implicitly relying on baryons in this sense. As soon as we reach decoupling, at , the behaviour of the photons becomes qualitatively different and cannot be modelled as a fluid.
We should switch mental models at and start thinking of the behaviour of individual photons (which start propagating unimpeded along straight lines) rather than of a fluid. This argument suggests we will end up seeing the field, frozen at and sampled on a sphere at the distance corresponding to the last scattering surface (see Figure 21).
The observed patterns will be formed from a superposition of solutions like (436) for different ’s, with the being related to the random fluctuations generated by inflation, . The modes that will be most prominent are those caught at the extrema of their oscillation, i.e. those for which , where is the sound horizon at decoupling and is an integer.
To get a rough idea of what this means, we can just assume matter domination for which to get the approximate angular scale of the first peak, . Plugging in the numbers gives you an angular scale of radians . According to Section 5 this translates into . Take a look at Figure 20; given the huge number of simplifications we’ve taken, this is a pretty good result!
You made a related calculation in Exercise 1. Back then, we were looking at the horizon scale at decoupling with an eye to quantifying the “homogeneity” problem. We kept in slightly more detail in the form of including radiation in the solution for , but we hadn’t taken into account that tight coupling means the speed with which disturbances propagate is rather than just , the speed of light. If you like, you can combine the best of both worlds to get a better estimate for . But the most important thing to take away is the link between these two points: the first peak of the CMB roughly corresponds to the horizon at the time of decoupling. The fact that there is any structure in the CMB at lower (larger scales) tells us that some process – probably inflation – created correlations on super-horizon scales.
15.4 First improvement: observational effects of streaming and gravity
Let’s start fixing some of the simplifications we’ve made. First, we have been very slapdash in understanding how the temperature fluctuations translate onto the observed sky, assuming that we can “see” directly. There are two complications which mean this is not so. First, the rest-frame in which is calculated is moving at a speed relative to the conformal Newtonian frame. From the special relativistic doppler shift we know that an observer at rest in this frame, looking in a direction , would see a temperature
| (438) |
and consequently we have
| (439) |
where I am using “*” subscripts to remind us that these are being calculated at the redshift of last scattering. But this is still not the observed temperature fluctuation because the photons are redshifted by the cosmic expansion between and the present day; the overall scalefactor doesn’t matter (since is a fractional variation) but the local variations due to fluctuations in do matter. To calculate this effect, we need to go all the way back to equation (46), and re-do the calculation for the case of an inhomogeneous universe. As this involves a few subtle manipulations, I’ll outline how it works – but this is non-examinable and you can skip straight to the result in equation (445) if you prefer.
Ready? First, we recall that, given a null geodesic with momentum , the time component of the geodesic equation gives us
| (440) |
where, when including perturbations, the no longer vanish for so all components must be calculated. After this exercise is complete, and simplifying using the null geodesic condition , one gets
| (441) |
We now need to make two transformations; the first we covered back in Section 5, showing that . The only difference is that we are now working with conformal time so (whereas earlier we had ).
In a footnote in Section 5 I mentioned how cannot, in general, be identified with the observed energy because it is not coordinate-invariant. There it seemed like an academic concern, but here it has real consequences; we instead have to carefully construct an observer’s 4-velocity which is in the time coordinate direction but normalized such that . This procedure gives us , so . The rate of change of log energy with respect to conformal time is consequently given by
| (442) |
to first order in . Before substituting equation (441), let’s rewrite one of the terms:
| (443) |
– that’s just the standard expression for the total derivative along the photon trajectory (derive it starting from the definition of if this isn’t clear to you). So, finally, we can put everything together to get
| (444) |
The is the normal redshifting term, recovering in the absence of perturbations (again, if this isn’t clear, try deriving it from the equation above with ). Then there is a term that is a total derivative in (that is, the derivative is calculated along the photon trajectory) and two which are partial derivatives in (that is, calculated at fixed spatial coordinates). We can combine the shift in implied by the above equation (ignoring the homogeneous redshifting term ) with our earlier result for , to get the actually observed temperature:
| (445) |
Let’s recap where all of these terms have come from and what they mean:
-
•
is the intrinsic temperature fluctuation in the fluid rest frame;
-
•
is the Doppler shift required to transform into the conformal Newtonian coordinate frame;
-
•
is the gravitational potential at the last scattering surface, and has arisen from integrating the term – it is known as the Sachs-Wolfe term;
-
•
is the gravitational potential at the observer and has also arisen from integrating the term – since this is the same for all photons received, it is a uniform offset across the sky and can be ignored;
-
•
The term left as an integral cannot be further simplified in general. The integral implicitly travels along the photon trajectory, so does not cancel the partial derivatives which are taken at fixed coordinates. That said, during matter domination, potentials are fixed so this term vanishes. Only when dark energy takes over does it contribute; this contribution is known as the integrated Sachs-Wolfe effect (Section 2).
One consequence of starting to include gravity in our description of the CMB is that the patterns on sub-horizon scales become sensitive to , the physical non-relativistic mass density of the universe, which is the major source of at decoupling.
15.5 Low-: the Sachs-Wolfe plateau and the integrated Sachs-Wolfe effect
Modes with are super-horizon as we saw in Section 3. Consequently, for these modes, traces ; specifically one may show that4242 42 We can use equation (354a) in the limit and to derive . From there we need to assume a relationship between and ; on super-horizon scales, this cannot have changed from the initial adiabatic conditions. In those, where there is only one degree of freedom, the relationship can be derived by considering an effective change in scalefactor from one position to another, i.e. we can think of whereas which gives . Putting everything together gives , i.e. . . The velocities are also negligible since they are suppressed by . So, according to the Sachs-Wolfe formula (445), the observed temperature fluctuations trace .
It turns out that a scale-invariant spectrum (such as on the large scales we are considering – see Section 7) leads to a flat spectrum in the ’s. (To prove this requires calculating the relationship between Fourier modes in 3D space and their projections onto a sphere, and is not examinable.) This flat spectrum is actually seen – it’s not so obvious from Figure 20, but if we re-plot just the first few ’s, this “Sachs-Wolfe plateau” is present around (Figure 22). At lower still, there is a slight rise in power which comes from the integrated Sachs-Wolfe effect mentioned above. The ISW signal is confined to low because it is imprinted by large-scale structure close to the observer.
15.6 Odd-even peak modulation
Another effect of the Sachs-Wolfe formula is an asymmetry between even and odd peaks. Remember that ultimately one calculates (or, from observed data, ) – see Section 6. This is quadratic in the observed temperature [see e.g. equation (294)]. The first two terms in equation (445) fluctuate as a function of , but the term at decoupling is dominated by the cold dark matter (see below), where the transfer function is vastly smoother. In effect we are taking the square of a wave () with a constant offset () which makes for an asymmetry between odd and even peaks:
You can see the effect of this modulation in Figure 20. Successive peaks don’t reach the same height – that’s partly due to damping that we’re yet to discuss (Section 9), but the fact that the second peak is so much lower than the first, whereas the third and second reach the same height, is down to the odd-even peak modulation.
This modulation isn’t just a curious phenomenon – it’s a helpful diagnostic. To understand why, we need to re-introduce gravity into the dynamics.
15.7 Dynamical effect of gravity
At this point, we are in a slightly inconsistent state with our various approximations. We have now included the gravitational effects on photon propagation to reach equation (445) and have briefly discussed some of the consequences. However, we have not included any of the effects of gravity on the dynamics.
We have all the ingredients we need to do this. We first restore to the equations (430) for radiation fluctuations, also setting :
☞ Exercise 15E
Show that the new solution is
| (446) |
is determined by a mixture of and also , the cold dark matter fluctuations, through equation (354a) (with the RHS summed over the two fluids). In the matter-dominated regime, which is reached well before decoupling, is constant as a function of (see Section 1), and the modification is actually straight-forward:
| (447) |
so that the effect of gravity is to offset the mean value of each mode, rather like it does in equation (445). The difference now is that (a) there is an offset in the dynamics, not just the observations; (b) the sign is reversed – in fact this suggests that the effect will cancel completely once (447) is inserted into (445). To see why this cancellation isn’t realised in practice, we need to return to the effects of baryons.
Briefly before that, I should mention that in principle there is a complication with setting in our new solution (which is what we did in Section 3). Now that appears in the dynamical equations, the potential oscillations that occur in the radiation-dominated regime [according to equation (364)] can have the effect of mixing between the and part of the solution. We’ll ignore this potential complication by saying that more sophisticated numerical solutions show it to be a subdominant effect4343 43 You can persuade yourself a little bit that this effect can’t be huge by noting that the Poisson-like equation (360) tells us that , so for the problematic sub-horizon modes with the magnitude of the forcing terms in are much smaller than the terms in ..
15.8 The effects of baryons
So far we have treated the photon fluid as though the mass density of the baryons can be neglected. Let’s now revisit that issue and treat the coupling between baryons and photons in a self-consistent way.
The primary effect of tight coupling is to equalise the velocities of baryons and photons, making . From this we can calculate what the relationship between their densities must be:
For adiabatic fluctuations such as those predicted by single-field inflation, the constant is in fact zero because the perturbations are generated by an effective change in scalefactor from one position to another, i.e. we can think of whereas which gives .
Now we introduce the “baryons+radiation” fluid, denoted by subscript “”. The time-dependent mixture between the baryons and the radiation is normally parameterised by the baryon loading factor , where by convention. (Note that has no relationship at all to the comoving curvature perturbation from Section 14.)
The exercise above allows us to make a substantial simplification to the Euler equation (428) for the combined baryon-photon fluid in the tight-coupling approximation:
| (451) |
On the right-hand-side I’ve intentionally replaced by using (449), which leads to a much simpler expression (some factors involving obligingly cancel). We can supplement this with the standard continuity equation for the photons, the first of equations (430), since this is not actually changed (there are no processes in play that absorb or emit photons or change their energies – only their directions are being altered). Putting it all together as normal (i.e. taking the derivative of the continuity equation, substituting equation (451), and writing as before) we get the full equation for taking into account the baryon loading:
| (452) |
This is about the most detailed description we can get within the fluid approximation. You can verify that as it boils back down to the expression we had before.
As always, we take and neglect the and terms (see the discussion above). First consider the situation without gravity; then equation (452) differs from the bare-bones equation (434) only through the addition of a damping term proportional to . As it turns out, however, this damping is small compared to Silk damping (Section 9) which arise from departures from the perfect coupling approximation. So the major effect is just that the speed of sound varies over time. If it does so sufficiently slowly, equation (436) continues to be a good approximate solution – though now the sound horizon is no longer directly proportional to but must instead be calculated from integrating the second part of that equation explicitly.
Once we re-introduce gravity through the term, we get a solution a bit like equation (447) but with a different scaling:
| (453) |
When combined with equation (445), the overall offset from the potential is proportional to . This makes the odd-even peak asymmetry (Section 6) highly sensitive to the baryon density.
15.9 Silk Damping
In Exercise 1, you showed that the mean free path of a photon shortly before decoupling was a few megaparsecs. Below this scale, the tight-coupling approximation fails. In fact, the idea of the photons forming a “fluid” breaks down on such scales, because the free-streaming leads to directional dependence of the brightness in a way that can’t be characterised just by the temperature and velocity . In a full treatment, these are just the first two moments of a distribution function, and all higher order moments in principle need to be treated.
However, as a rough expectation, we can calculate the distance that a photon travels in a “random walk” with the calculated mean free path. Since its energy is not altered during this random walk, fluctuations in temperature below this scale will be erased. Very approximately, the relevant scale is where is the number of scatterings, which will be approximately . Overall, one can therefore conclude that
| (454) |
This in turn means that it starts to significantly damp the CMB for .
The resulting damping of the oscillations at high is approximately exponential as seen in Figure 20. As you saw in Exercise 1, the damping scale will be sensitive to , giving another way that the CMB measures the baryon density.
The combination of damping with the rise of foreground effects on small scales means that the Planck satellite has essentially mapped out the CMB temperature fluctuations to the smallest scales that are worth measuring.
15.10 Summary
The observed power spectrum of the cosmic microwave background has a rich phenomenology. In the previous section, some of the major results include:
-
•
The CMB gives access to the primordial spectrum of fluctuations. The scaled power spectrum , as plotted in Figure 20, would be near-flat as a function of if the primordial near-scale-invariant spectrum were directly imprinted. However…
-
•
…the fluctuations that are seen are actually processed by the transfer function and the observational effects encoded in the Sachs-Wolfe equation (445). This is a double-edged sword: it partially obscures the primordial information by reshaping it as a function of scale, but it also imprints a great deal of helpful data about the universe’s composition.
-
•
The scale of the first peak, , corresponds to the “baryon acoustic oscillation” scale — the projection of the baryon-photon fluid’s sound horizon at baryon-photon decoupling.
-
•
The baryon density changes the sound speed in this fluid, and so moves the positions of the peaks. However…
-
•
…like many things in the CMB, this effect can also be partially mimicked by changing the geometry of the intervening universe so is not a completely unique signature.
-
•
The upside is that the CMB can tell us something about and through their geometric effects on the shape of space and distance to last scattering. In particular, and as we discussed in lectures at the start of the course, the scale of the first peak measured in the CMB anchors the comoving scale of the same baryon acoustic oscillations seen in lower- large-scale-structure surveys. This allows a determination of and consequently gives strong evidence for the accelerating universe (alongside the more famous results from supernovae which constrain acceleration through ).
-
•
Peaks beyond the first are “overtones”. The relationship between the heights of the peaks is sensitive to the overall baryon density because the temperature fluctuations described by (453) have an -dependent offset.
-
•
The overall amplitude beyond the first peak is sensitive to the baryon density and cold dark matter density through gravitational effects.
-
•
Modes with were superhorizon at the time of last scattering, and a hint of the flat spectrum in can be seen, although…
- •
-
•
At high , the temperature anisotropies are suppressed by Silk damping, which is caused by photons’ finite mean-free-path breaking the tight-coupling approximation.
The measurement of the temperature power spectrum has essentially been completed by Planck. Even though its measurement will not improve very much further, it will remain for the foreseeable future the cleanest and tightest way to constrain the density of the universe’s constituents. Measuring the CMB anisotropies has propelled cosmology into an era of precision that was once thought impossible.
Future work in CMB cosmology will focus on two areas. First, future instruments will be targeted at measuring the polarisation of the radiation. Experimentally, polarisation – especially sought-after gravitational wave constraints on large scales – is harder to measure than temperature due to the high relative signal strength of foreground modes. Theoretically, understanding the polarisation requires a more detailed study of the transfer function, using a Boltzmann hierarchy rather than a fluid approximation.
The second area where future work will be focussed is on non-Gaussianity in the temperature patterns. Experimental constraints are again made difficult by the foregrounds and instrumental noise (which become more problematic as one measures higher order moments). Theoretically, understanding non-Gaussianity requires a beyond-linear treatment of perturbation theory.
Both avenues offer the possibility to start pinning down the parameters of inflation, in turn telling us about physics at the GUT scale, 12 orders of magnitude higher than that which can be probed by terrestrial experiments such as the Large Hadron Collider.